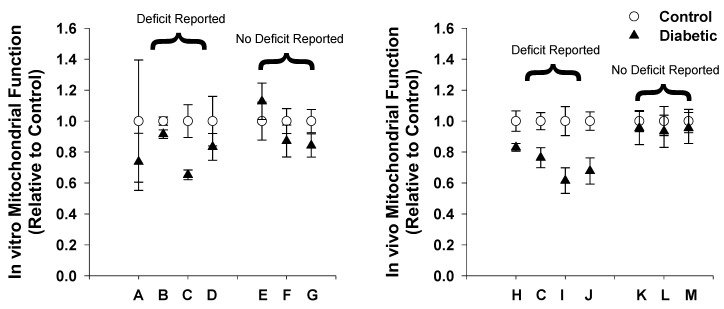
Figure 4.
Summary of human mitochondrial (dys)function in diabetes. Data of reported mitochondrial (dys)function was compiled from the literature and presented relative to respective control subjects. Control (white circles) is always equal to 1 and diabetics (black triangles) presented as a fraction of that determined from the reported measures of function. This was determined for (A) in vitro and (B) in vivo studies where both deficits and no deficits in mitochondrial function have been reported. A) Kelley 2002; B) Mogensen 2007; C) Phielix 2008; D) Ritov 2005; E) Abdul-Ghani 2009; F) Boushel 2007; G) Hey-Mogensen 2010; H) Meex 2010; I) Scheuermann-Freestone 2003; J) Schrauwen-Hinderling 2007; K) De Feyter 2008; L) Praet 2006; M) van Tienen 2012.

