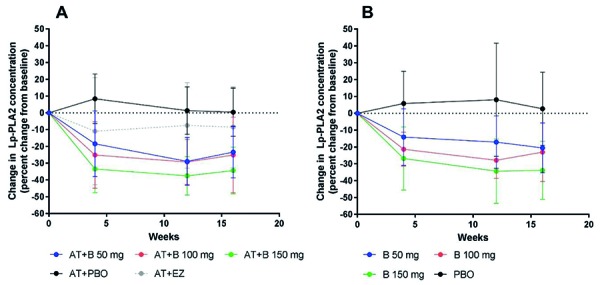
Figure 6. Percent change from baseline in Lp-PLA2 in the atorvastatin treatment groups (A) and the treatment-naïve groups (B). Lp-PLA2 = lipoprotein-associated phospholipase A2; AT = atorvastatin; B = bococizumab, PBO = placebo; EZ = ezetimibe. Error bars represent standard deviation.

