Figure 5.
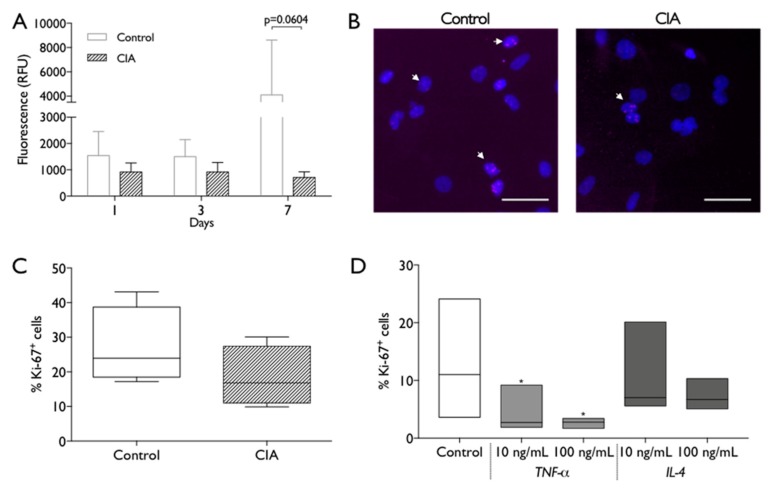
MSC metabolic activity and proliferation capacity. (A) Metabolic activity was measured at 1, 3 and 7 days of MSC culture by resazurin assay. RFU: relative fluorescence units. Statistical differences were evaluated by 2-way ANOVA followed by Turkey’s multiple comparison test (B) Representative images of nuclei (Dapi, blue) and Ki-67 immunostaining (pink, white arrows) of control and CIA-derived MSC after 2 days in culture. Scale bar: 50 µm. (C). Percentage of Ki-67+ control and CIA-derived MSC, across different experiments. Statistical differences were evaluated by Mann–Whitney test. (D) Percentage of Ki-67+ control- derived MSC after 2 days in absence/presence of 10 ng/mL or 100 ng/mL of TNF-α or IL-4. Box plots represent min-to-max distribution of n = 4 to 5 animals per group. * p < 0.05 by Friedman test followed by Dunn’s multiple comparisons test.

