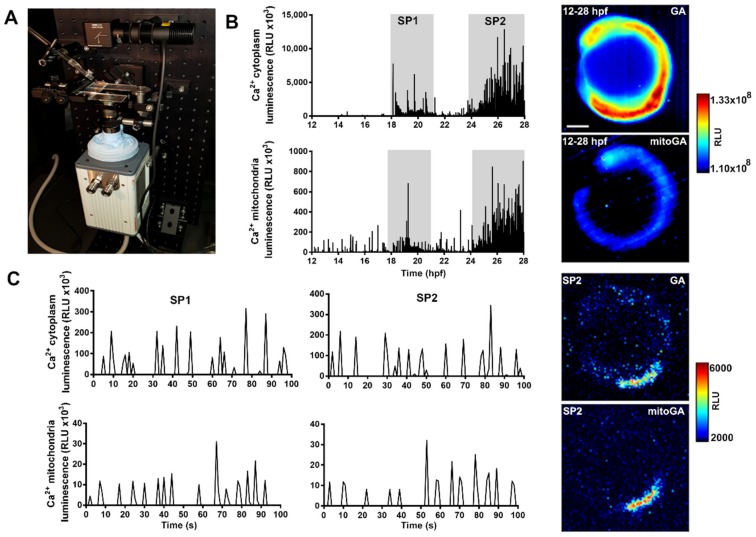
Figure 3.
Continuous luminescence imaging of spontaneous Ca2+ transients in the trunk of zebrafish from 12 to 28 hpf. (A) Home-made low light microscope with EMCCD camera. (B) Representative experiments showing two periods of increased Ca2+ signaling, SP1 and SP2, in the cytoplasm and in mitochondria. Note the different luminescence scales. The images next to the graphs show the accumulated luminescence from 12 to 28 hpf. (C) Bioluminescence traces (100 s) corresponding to SP1 and SP2 in the cytoplasm (top graphs) and mitochondria (bottom graphs). The images on the right show one Ca2+ spike in the cytoplasm (top) and mitochondria (bottom) during the SP2 period. Images were acquired at 1 Hz. The scale bar represents 200 µm. The color scale indicates RLU.

