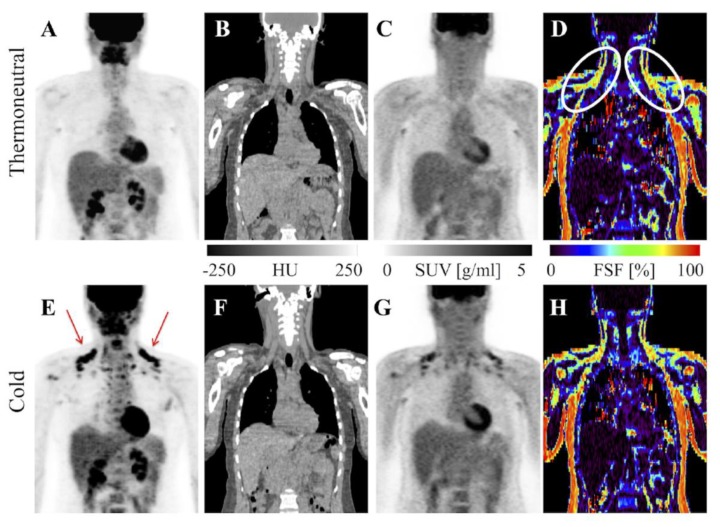
Figure 3.
MRI vs. FDG-PET/CT in detection of BAT. FDG-PET/CT and MRI of a healthy BAT-positive research subject. FDG uptake is visible in supraclavicular BAT with cold exposure on the PET maximum intensity projection (MIP; E, red arrows) and absent from the thermoneutral PET MIP (A). CT shows adipose tissue in the same region (B,F) and PET shows increased standardized uptake value there after exposure to cold (C,G). MRI-derived fat signal fraction from the same subject shows adipose tissue with relatively low levels of fat (white ovals) in the same region at thermoneutral and cold conditions (D,H). Image reproduced with permission from reference 41.

