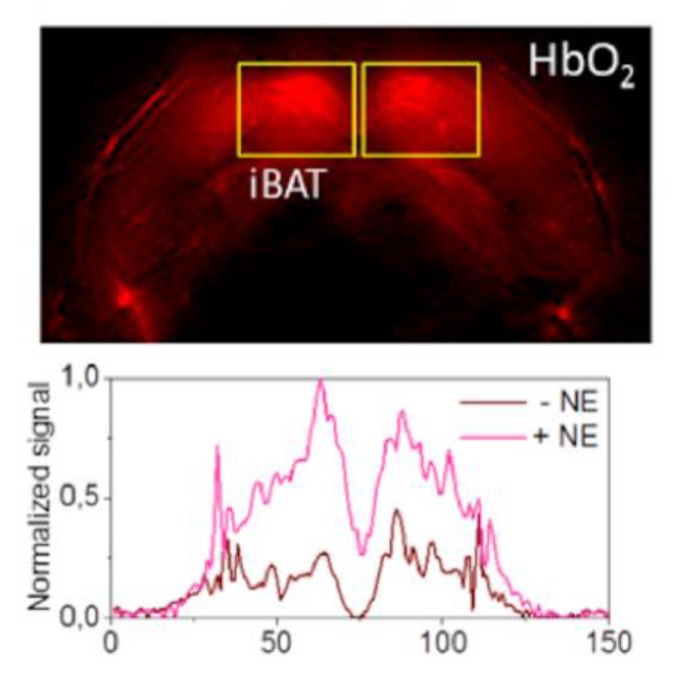
Figure 11.
MSOT HbO2 map after norepinephrine treatment. MSOT image unmixed for HbO2 signal of murine interscapular BAT after treatment with norepinephrine (NE; top panel). BAT pads are shown in rectangles. The bottom panel shows the horizontal intensity profile with and without NE treatment. Image reproduced with permission from reference 95.

