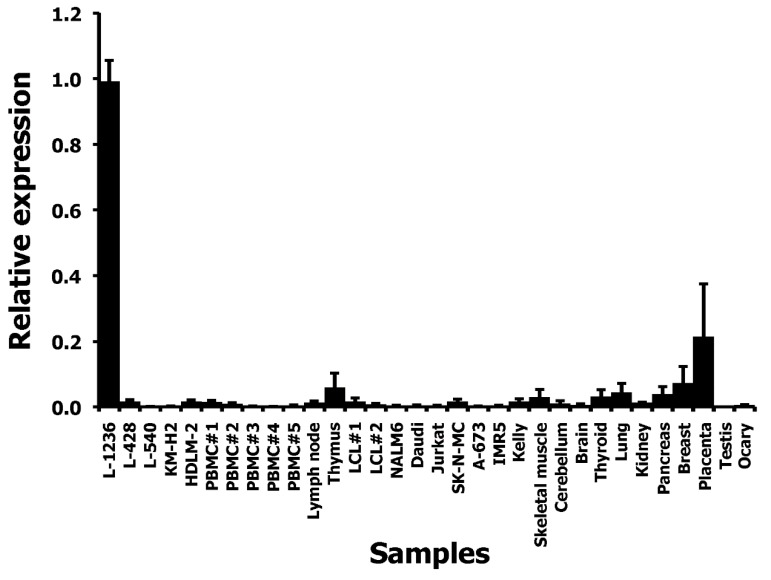
Figure 2.
Quantification of THOLE transcripts in HL cell lines and other samples. cDNA from HL cell lines, PBMC, and a panel of normal tissues and tumor cell lines was used as template for quantitative RT-PCR. Expression in L-1236 cells was set as one. Presented are means and standard deviations from three experiments.

