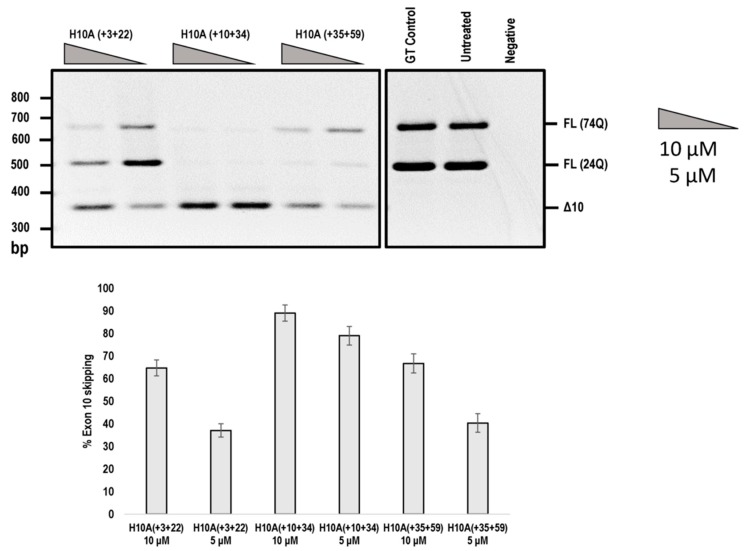
Figure 5.
Agarose gel fractionation of ATXN3 transcript products from SCA3 patient derived fibroblasts, following PMO transfection at concentrations of 10 and 5 μM. Fractionation shows full-length products (FL 74Q; FL 24Q) and removal of exon 10 (Δ10) (product size of 362 bp). Densitometric analysis of the gel image is shown below the gel (means plus error bars. Error bars = standard deviation, n = 3). (FL= full-length, Δ10 = exon skipped product, GT = Gene Tools control PMO, Q = glutamine).

