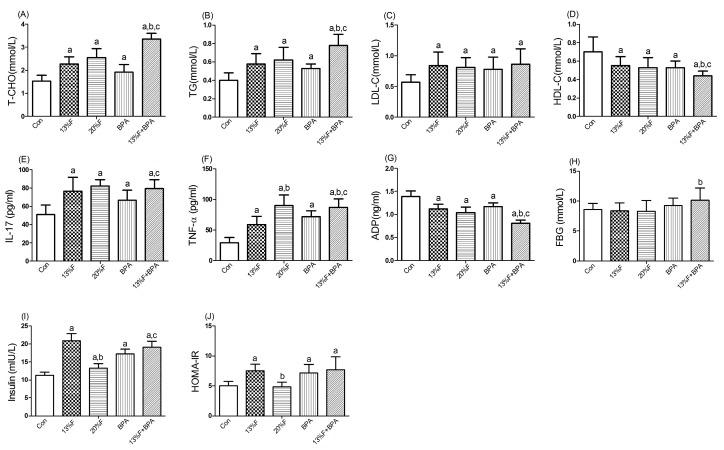
Figure 2.
Effects of fructose and/or BPA exposure on lipid profile, inflammatory cytokines and ADP. Serum levels of (A) T-CHO; (B) TG; (C) LDL-C; (D) HDL-C; (E) IL-17; (F) TNF-α; (G) ADP; (H) FBG; (I) insulin; (J) HOMA-IR of male rats after eight weeks of treatment with fructose and BPA. Values are expressed as means ± SD, n = 10. Differences between groups were considered as significant at p < 0.05 and were analyzed with one-way ANOVA. a different compared to Con; b different compared to 13% F; c different compared to BPA (p < 0.05). Con, control group; F, fructose group; BPA, 1 µg/mL BPA group.

