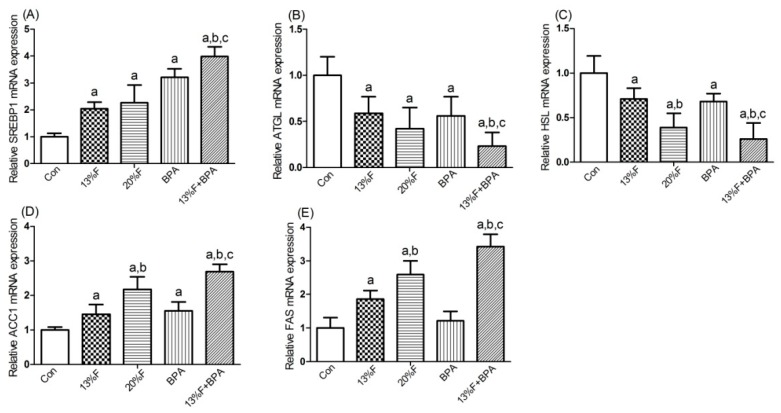
Figure 4.
Effects of fructose and/or BPA exposure on the expression of genes involved in lipid metabolism in liver. Gene expression (qPCR) of (A) SREBP1; (B) ATGL; (C) HSL; (D) ACC1; (E) FAS in male rats after eight weeks of treatment with fructose or/and BPA. Values are expressed as means ± SD, n = 6. Differences between groups were considered as significant at p < 0.05 and were analyzed with one-way ANOVA. a different compared to Con; b different compared to 13% F; c different compared to BPA (p < 0.05). Con, control group; F, fructose group; BPA, 1 µg/mL BPA group.

