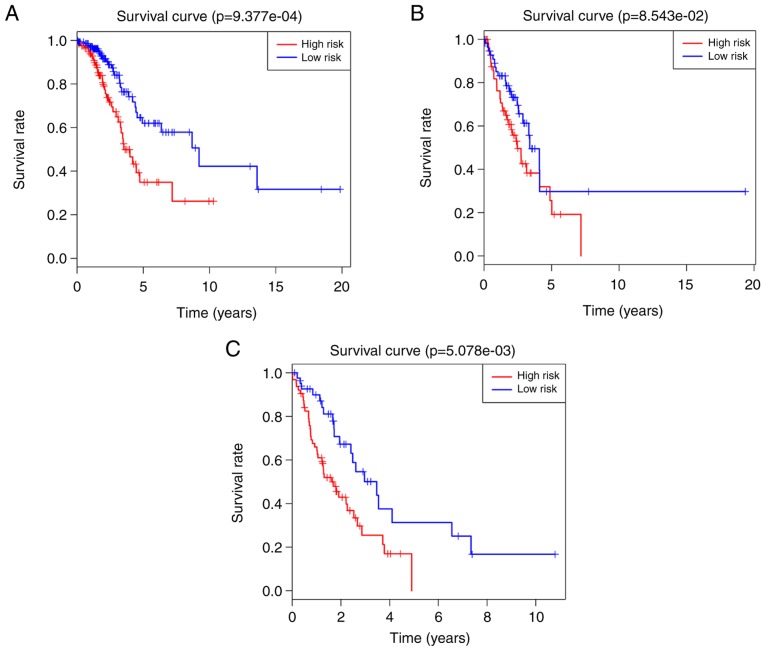
Figure 3.
Survival analysis on the high- and low-risk groups in each tumor node metastasis stage, based on the 5-long non-coding RNA signature. Kaplan-Meier survival curves for (A) stage I, (B) stage II and (C) stage III/IV groups, and the ‘+’ on the survival curves represents the censored data-points.

