Figure 6.
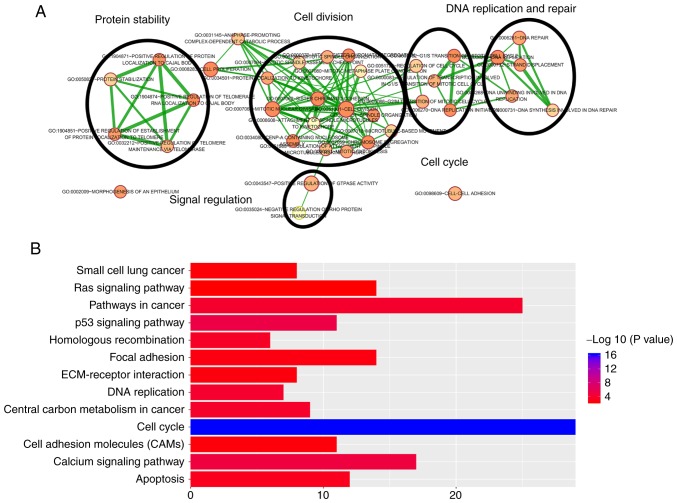
Functional enrichment analysis of 1,068 protein-coding genes co-expressed with the 5 prognostic long non-coding RNAs. (A) Functional enrichment map of GO terms. Each GO term is represented by a node and the overlapping genes between connecting terms are represented by an edge. The node size represents the number of genes in the GO terms. The color intensity represents the degree of enrichment. (B) Significantly enriched Kyoto Encyclopedia of Genes and Genomes pathways. GO, gene ontology; ECM, extracellular matrix.

