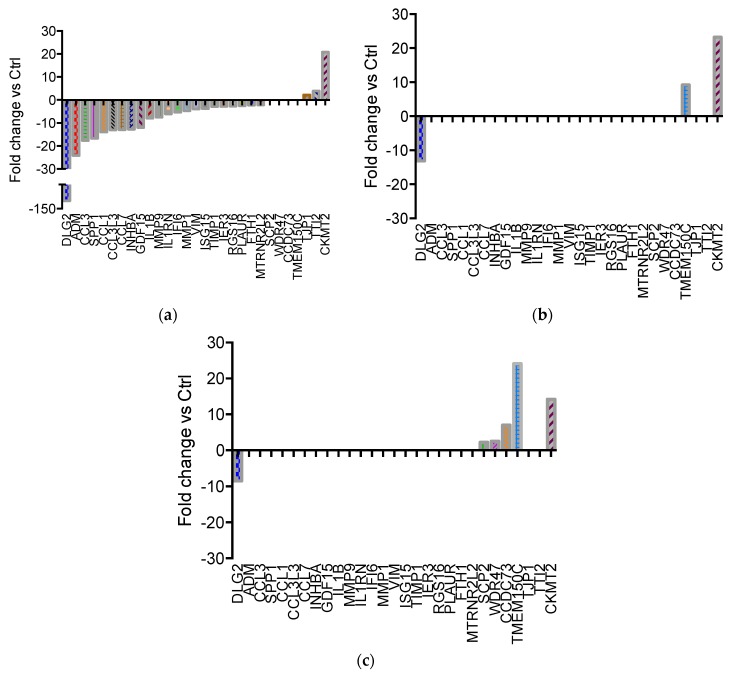
Figure 1.
Differentially expressed genes in U937 cells treated with lysozyme 15 μg/mL for 1 h and analysed immediately at the end of the treatment (1 h, a) or 2 h after the end of the treatment (1 h + 2, b), or treated for 24 h and analysed immediately at the end of the treatment (24 h, c). Fold change values in respect of parallel control samples are shown in ascending order. Complete gene expression data is available in Supplementary Table S1.

