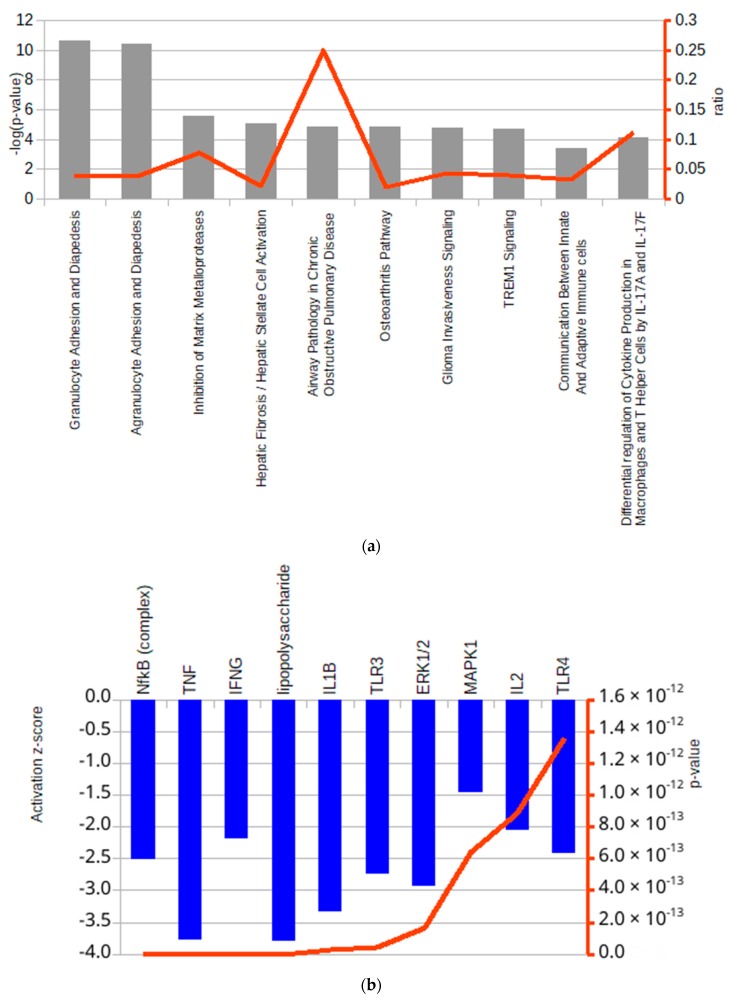
Figure 3.
Top ten canonical pathways (a) and top ten up-stream regulators (b) detected as altered by IPA® analysis. In (a) the ‘ratio’ value is the ratio between altered genes and total genes in the pathway, and in (b) bars represent the pathway z-score, the red line indicates the p-value of the prediction.

