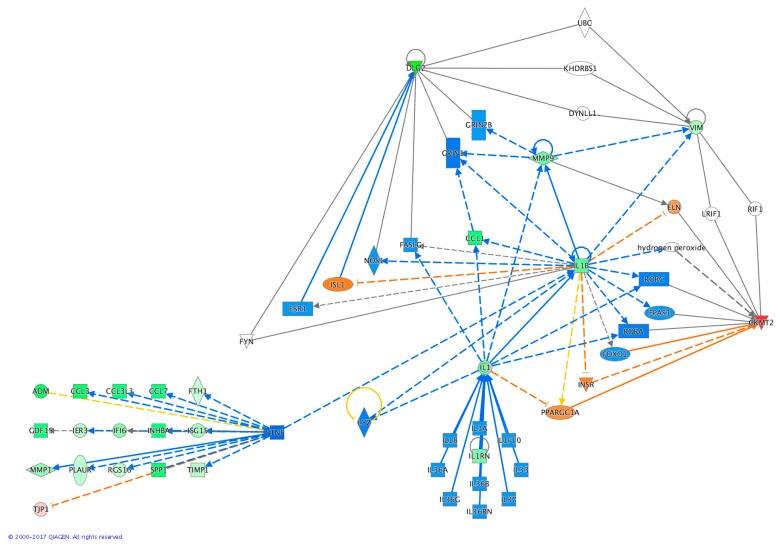
Figure 4.
IPA® analysis of signalling pathways of the genes differentially expressed upon lysozyme treatment. U937 cells were treated with lysozyme 15 μg/mL for 1 h and analysed immediately at the end of the treatment (1 h). Down-regulated genes by lysozyme treatment are marked in green, up-regulated genes are marked in red, orange colour indicates the prediction of an activation, blue colour the prediction of an inhibition; continuous line indicates direct relationships, dashed line indicates an indirect relationship (one or more intermediates), yellow colour indicates relationships non-consistent with the state of the down-stream molecule, grey colour indicates an unpredicted effect.

