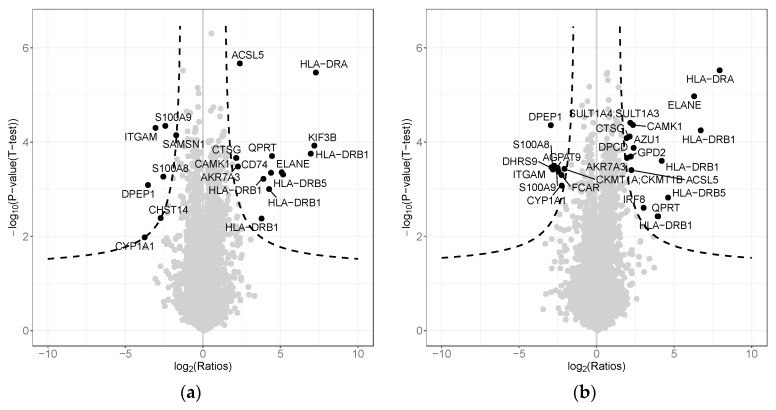
Figure 5.
LC-MS/MS (liquid chromatography-tandem mass spectrometry) analysis, volcano plots show the differences of protein abundance comparing the control cells at 24 h + 24 vs. 1 h + 24 (a), and lysozyme-treated cells at 24 h + 24 vs. 1 h + 24 (b). Dashed lines mark the threshold of statistical significance with FDR < 0.05.

