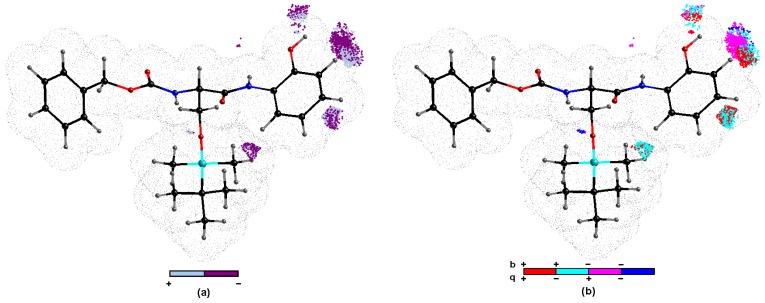
Figure 6.
Spatial sectors with the largest contribution into BChE inhibitory potency selected by CoMSA IVE-PLS for 17/8 training/test set samplings. Color coded contributions (a) and four possible combinations of mean charge q and correlation coefficient b values (b) for silicon-based carbamates 1–25. Reference compound 2 is illustrated as the most potent molecule.

