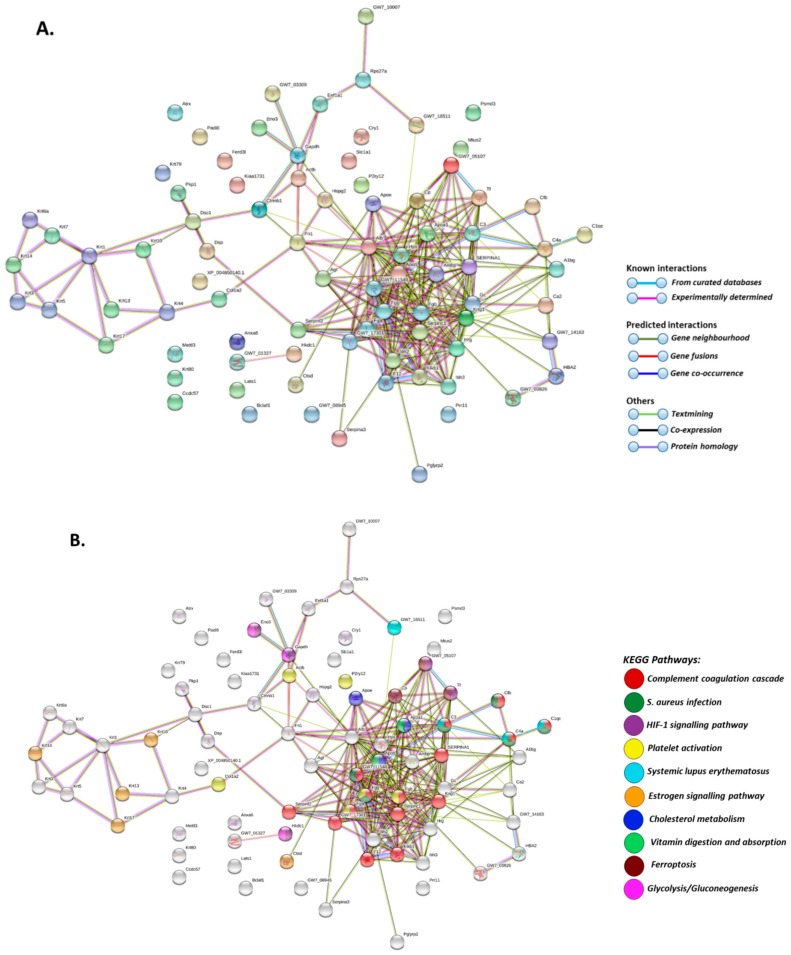
Figure 4.
Protein-protein interaction networks of deiminated proteins identified in plasma-EVs of naked mole-rat. Reconstruction of protein-protein interactions based on known and predicted interactions using STRING analysis. (A) Coloured nodes represent query proteins and first shell of interactors. (B) KEGG pathways relating to the identified proteins and reported in STRING are highlighted as follows: red = complement and coagulation cascade; dark green = Staphylococcus aureus infection; purple = HIF-signalling pathway; yellow = platelet activation; light blue = systemic lupus erythematosus (SLE); orange = oestrogen signalling pathway; dark blue = cholesterol metabolism; light green = vitamin digestion and absorption; pink = glycolysis/gluconeogenesis. Coloured nodes represent query proteins and first shell of interactors, white nodes are second shell of interactors. Coloured lines indicate whether protein interactions are identified via known interactions (curated databases, experimentally determined), predicted interactions (gene neighbourhood, gene fusion, gene co-occurrence) or via text mining, co-expression or protein homology (see the colour key for connective lines included in the figure).

