Figure 5.
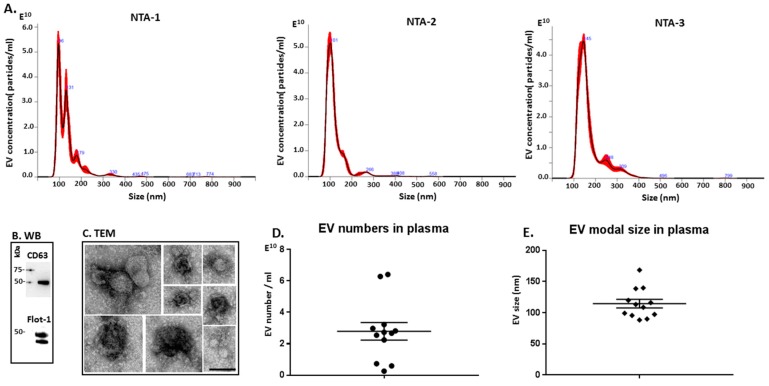
Extracellular vesicle profiling in naked mole-rat plasma. (A) Nanoparticle tracking analysis (NTA) shows a size distribution of EVs from naked mole-rat in the range of mainly 50 to 300 nm, with representative NTA profiles of EVs from 3 different animals (NTA-1, NTA-2, NTA-3). (B) Western blotting analysis confirms that naked mole-rat EVs are positive for the phylogenetically conserved EV-specific markers CD63 and Flot-1. (C) Transmission electron microscopy (TEM) analysis of naked mole-rat plasma-derived EVs shows typical EV morphology; a composite figure is shown and the scale bar (100 nm) applies for all images in the panel. (D) EV yield in plasma of 12 individual naked mole-rats is shown. (E) EV modal size in plasma of 12 individual naked mole-rats is presented.

