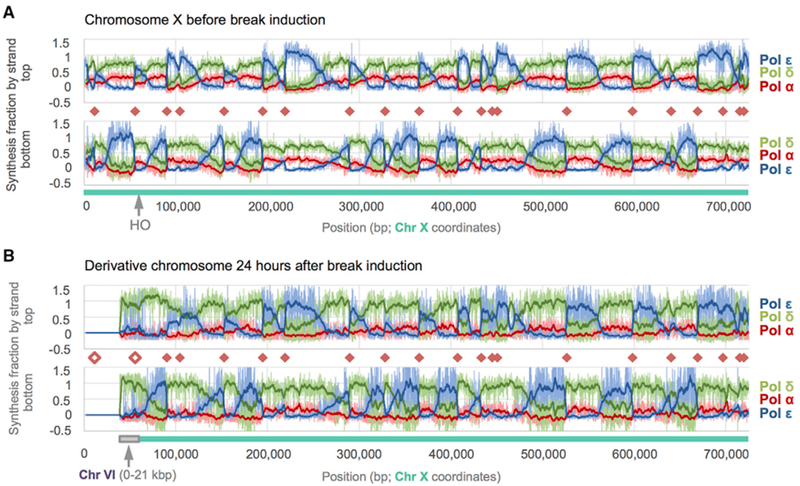
Figure 3. DNA Polymerase Enzymology on Chromosome X before and after HO Induction.

Fraction of synthesis across S. cerevisiae Chr X due to each replicative polymerase as calculated from HydEn-seq end densities. Chr-X- and Chr-VI-derived sequences are indicated beneath each graph by blue-green and gray bars, respectively. Fractional synthesis contributions due to Pols α, δ, and ε data are shown in shades of red, green, and blue, respectively. Pale lines are raw fractions (100-bp bins). Dark curves are 25-bin moving averages (2.5 kb). Origins (orange diamonds) coincide with abrupt reversals in Pol α + δ versus Pol ε trends. A greater reversal on one strand indicates an origin that is often overrun by forks proceeding from a neighboring origin.
(A) Synthesis fractions before double-strand break (DSB) induction mapped to the Chr X reference.
(B) Synthesis fractions 24 h post-DSB are mapped to the derivative chromosome, der(X)t(VI;X). Noise increases with incubation time (compare A to B), but polymerase usage patterns remain constant beyond the DSB +60 kb. The Pol α contribution is lower (indistinguishable from noise) on both strands in the donor region than in lagging strand regions elsewhere. The unfilled orange diamonds indicate origins that were deleted during BIR.
See also Figures S2–S4.
