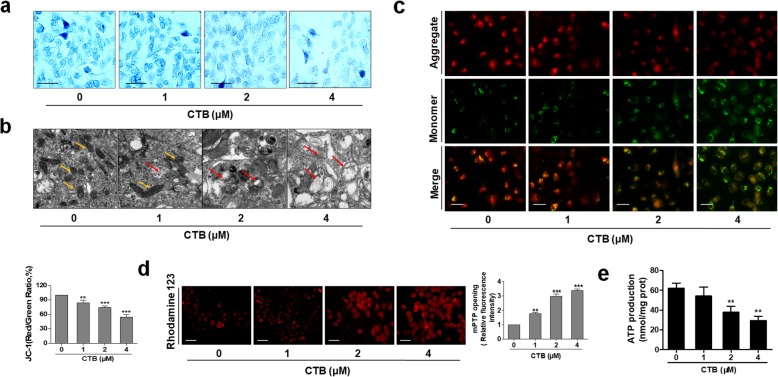
Fig. 2.
CTB destroyed mitochondrial structure and function of hepatoma cells. SMMC-7721 cells were treated with different CTB concentrations (0, 1, 2, 4 μM) for 24 h. a Janus green staining for detecting mitochondrial activity. Representative photographs were shown. Scale bar: 50 μm b Observation of mitochondrial morphology by Transmission Electron Microscope (TEM). Scale bar: 0.2 μm. c Effect of CTB on MMP (ΔΨm) was determined in SMMC-7721 cells by JC-1 staining. Scale bar: 50 μm. d The opening of mPTP was detected by Rhodamine123 staining. Scale bar: 50 μm. e ATP generation was detected by ATP Detection Kit. Scale bar: 50 μm. Scale bar: 50 μm. Data are represented as the mean ± SD (n = 3). *P < 0.05, **P < 0.01 and ***P < 0.001 vs Control

