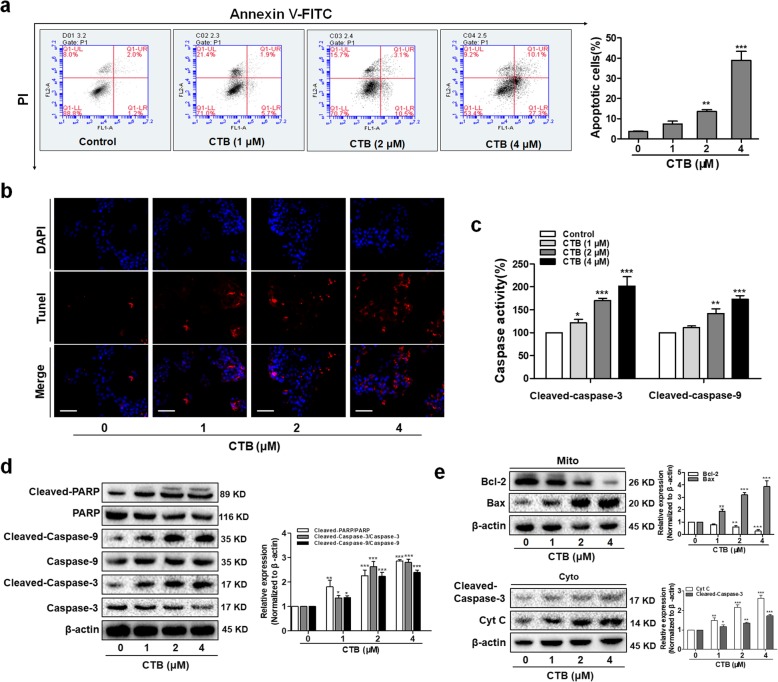
Fig. 3.
CTB triggered apoptosis through the mitochondrial death pathway in SMMC-7721 cells. Cells were treated with CTB at the indicated concentrations (0, 1, 2, 4 μΜ) for 24 h. a Flow cytometry analyses of cells apoptosis using FITC-labeled Annexin-V/PI staining. Cells situated in the right two quadrants of each plot were regarded as apoptotic cells. b TUNEL staining evaluated cells apoptosis. Red fluorescence indicated apoptotic cells. Scale bar: 50 μm. c Activity of caspase-3/9 was evaluated by caspase colorimetric assays. d The expression of Caspase cascades and PARP were determined by Western Blot. e The expression of Bcl-2/Bax and the release of Cyt C were determined by Western Blot. Data are represented as the mean ± SD (n = 3). *P < 0.05, **P < 0.01 and ***P < 0.001 vs Control

