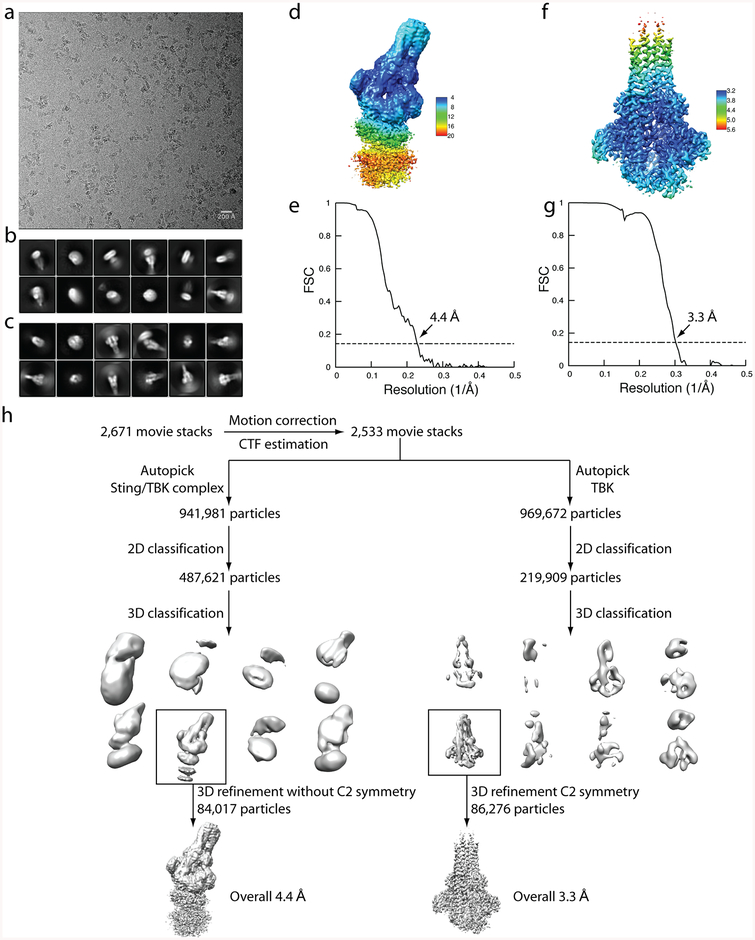
Extended Data Figure 2 |. Flow chart of cryo-EM image processing for the complex between chicken STING and human TBK1.
a, Representative micrograph. b, Representative 2D classes of the intact complex. c, Representative 2D classes from TBK1-focused image processing. n > 3. d, f, Final reconstructions of the intact STING–TBK1 complex (d) and from the TBK1-focused refinement (f), with colours based on local resolution. e, g, Gold-standard FSC curves of the final 3D reconstructions of the intact complex and from the TBK1-focused refinement. h, Image processing procedure.

