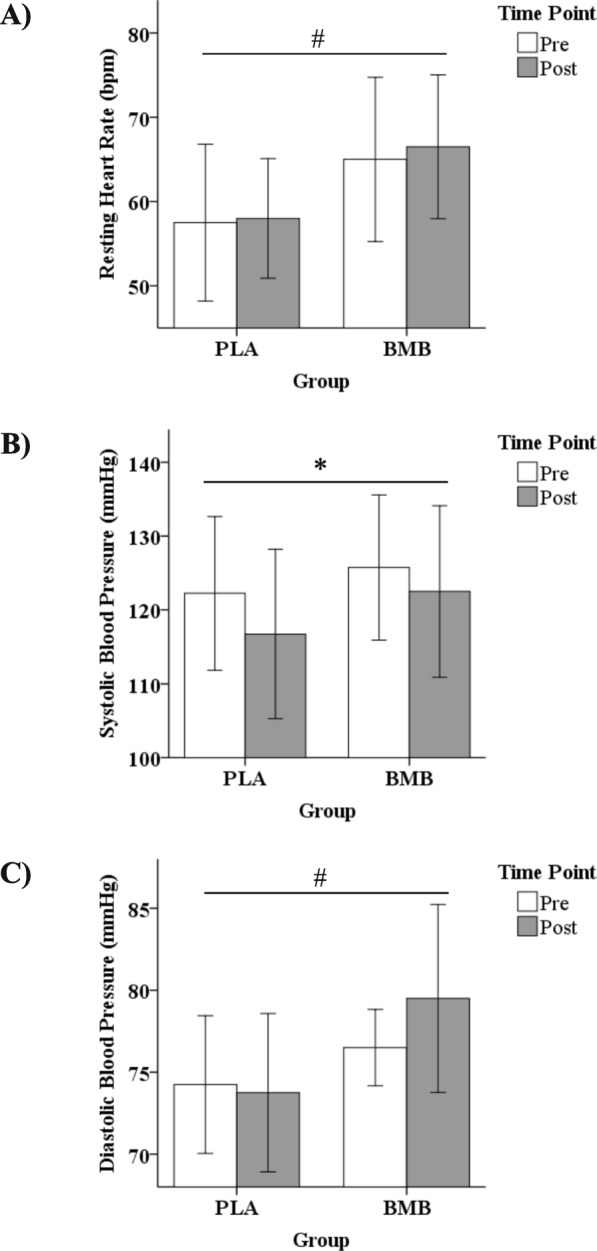
Fig. 3.

Mean ± standard deviation for a) resting heart rate, b) systolic blood pressure, and c) diastolic blood pressure at the Pre and Post time points for each group. Note. Whisker bars represent the standard deviation; PLA = placebo; BMB = Bang Master Blaster. * denotes statistically significant for the main effect of time. # denotes statistically significant for the main effect of group
