
Fig. 7.
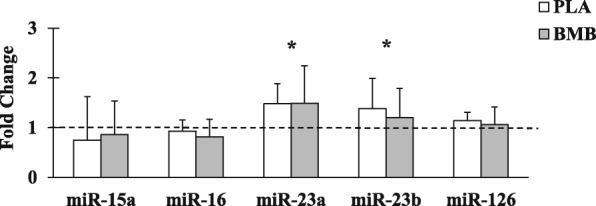
Average fold change in microRNA (miR) expression from baseline (represented by dashed line). Note. Whisker bars represent the standard deviation; PLA = placebo; BMB = Bang Master Blaster; * denotes statistically significant increase from Pre
Official websites use .gov
A
.gov website belongs to an official
government organization in the United States.
Secure .gov websites use HTTPS
A lock (
) or https:// means you've safely
connected to the .gov website. Share sensitive
information only on official, secure websites.
Average fold change in microRNA (miR) expression from baseline (represented by dashed line). Note. Whisker bars represent the standard deviation; PLA = placebo; BMB = Bang Master Blaster; * denotes statistically significant increase from Pre