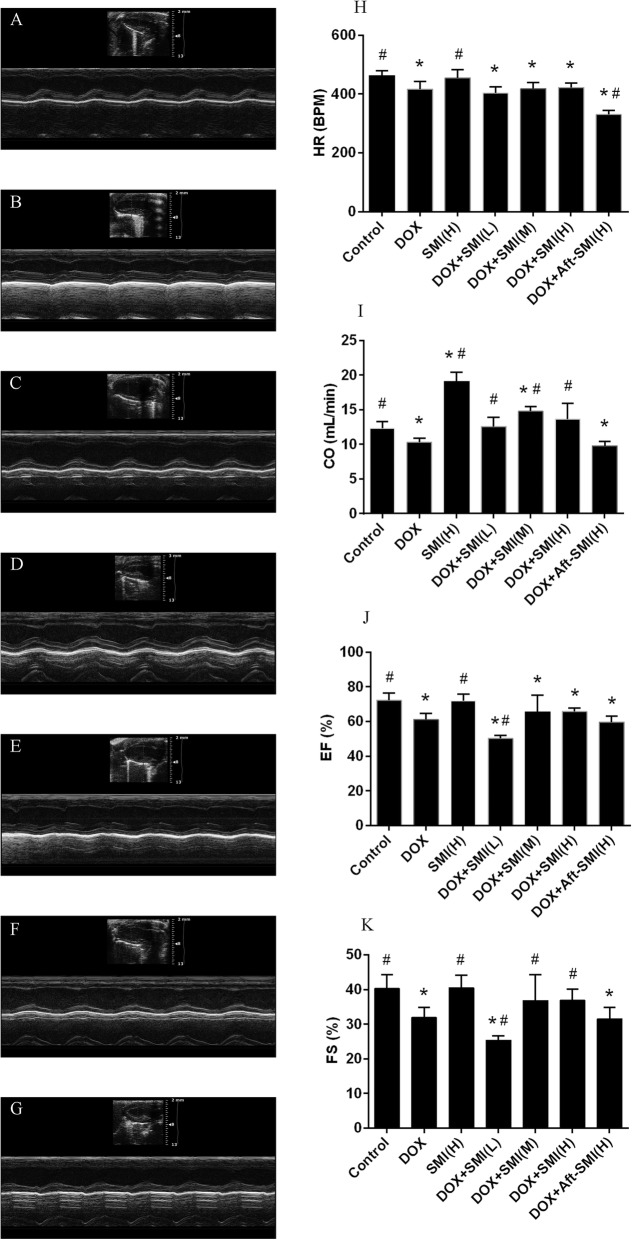
Fig. 3.
Effect of SMI on heart functional parameters after administration of DOX-inducedfrom control group (a), DOX group (b), SM injection group (c), co-treatment with DOX and SMI (0.5 g/kg) group (d), co-treatment with DOX and SMI (1.5 g/kg) group (e), co-treatment with DOX and SMI (5 g/kg) group (f) and the co-treatment with DOX and SMI (5 g/kg)) after treating (g). Representative M-mode echocardiograms of ICR mice. (h) Heart rate. (i) Cardiac output. (j) Ejection fraction. (k) Shortening index. The data are expressed as the mean ± S.D.; n = 10 in each group; *, significantly different (P < 0.05) from respective values in the control group; #, significantly different (P < 0.05) from respective values in the DOX group

