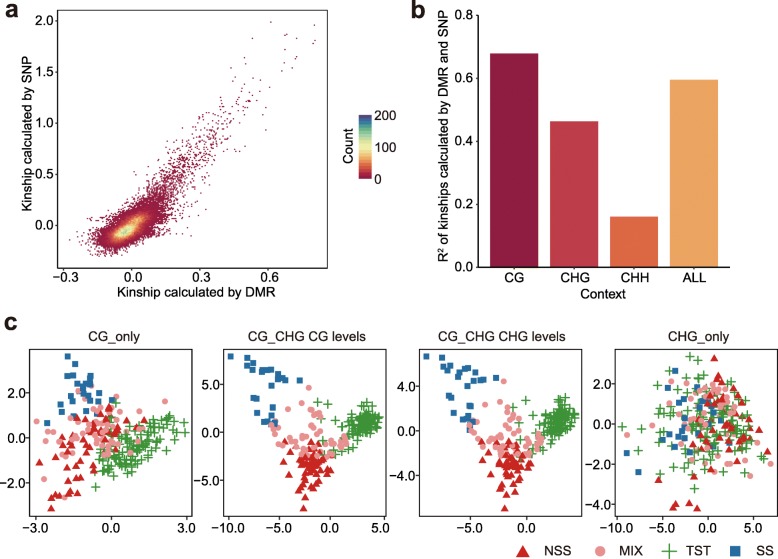
Fig. 2.
Comparison of genetic distance calculated using either SNPs or DNA methylation. a The correlation of kinships between any two lines calculated by SNPs or DNA methylation in CG context. The color reflects the density of points. b The squared Pearson correlation coefficient (R2) between the two kinships calculated using either SNPs or the indicated DNA methylation. ALL means that the kinship was calculated using all three contexts. c PCA plots of context-specific DMRs. The color and shape of symbols reflect different subgroups of maize that are determined by SNPs. SS, stiff stalk; NSS, non-stiff stalk; TST, tropical or semi-tropical

