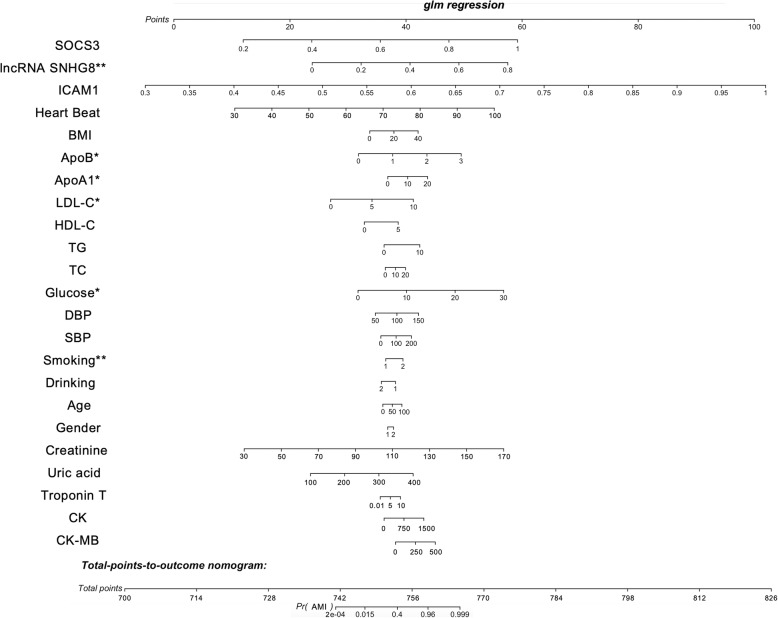
Fig. 7.
Nomogram to estimate individual AMI probability. The nomogram was constructed based on a logistic regression model for the outcome of definite AMI. Each predictor variable characteristic had a corresponding point value based on its position on the top point scale and contribution to the model. The probability of AMI for each subject was calculated by adding the points for each variable to obtain a total point value that corresponded to a probability of AMI from the scale presented on the bottom line. *P < 0.05, **P < 0.01

