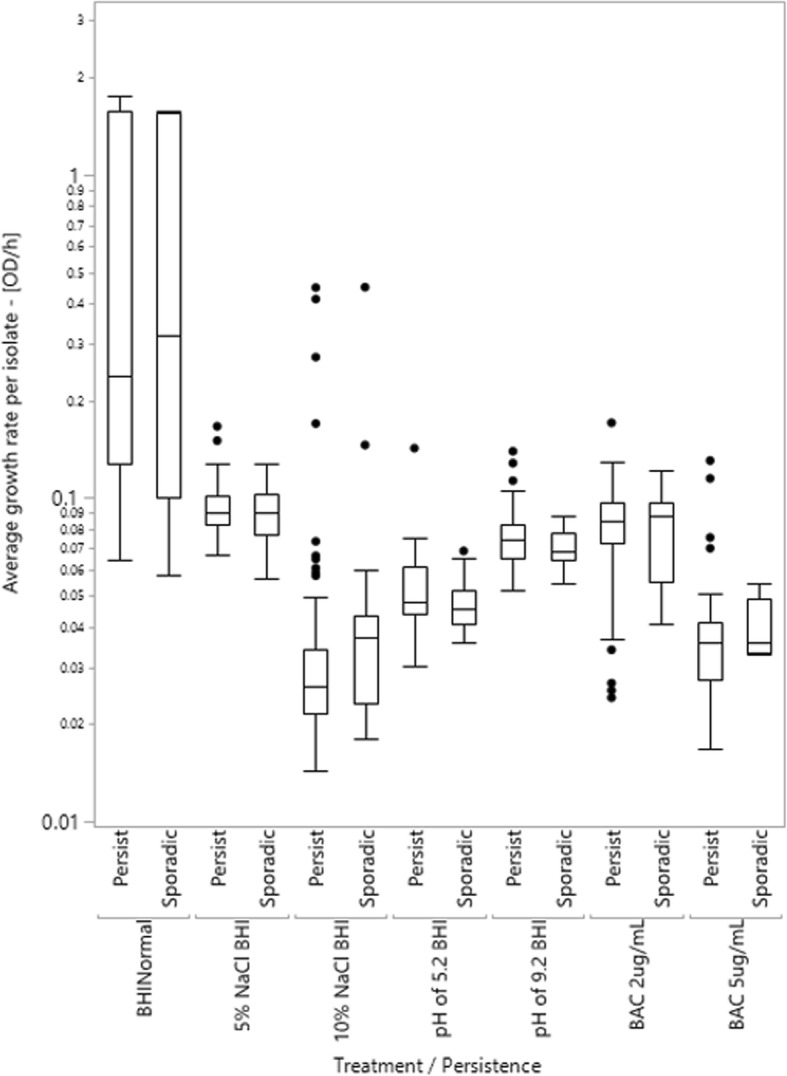
Fig. 1.

Box plots of average growth rate for L. monocytogenes isolates exposed to stress conditions, separated by their persistence factor. Data includes the average of only replicates where growth was observed (ΔOD600 ≥ 0.1), in log scale. The box represents the interquartile range (IQR), the line represents the median of the treatment, whiskers are drawn to the furthest point within 1.5 x IQR from the box, and the points are outliers of the data. No significant differences were observed in average growth rate between persistent and sporadic isolates for any treatment
