
FIGURE 1.
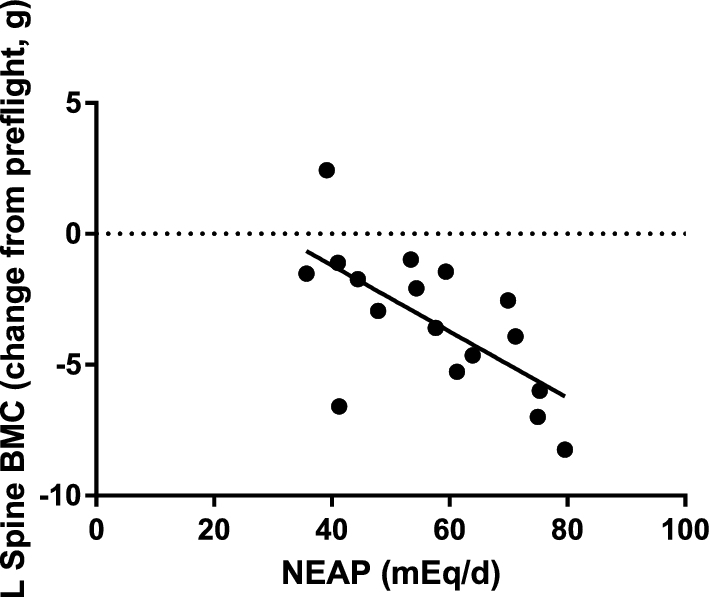
The dietary NEAP at the FD30 session (an average of 4 d) was related by Pearson correlation to the change in lumbar spine BMC after flight (r = 0.66, P < 0.01). Each point represents a single crew member (n = 17). Data from the FD30 time point, estimated from crew members’ diet for 4 d, was used as a proxy for crew members’ typical intake throughout their mission. BMC, bone mineral content; FD, flight day; L, lumbar; NEAP, net endogenous acid production.