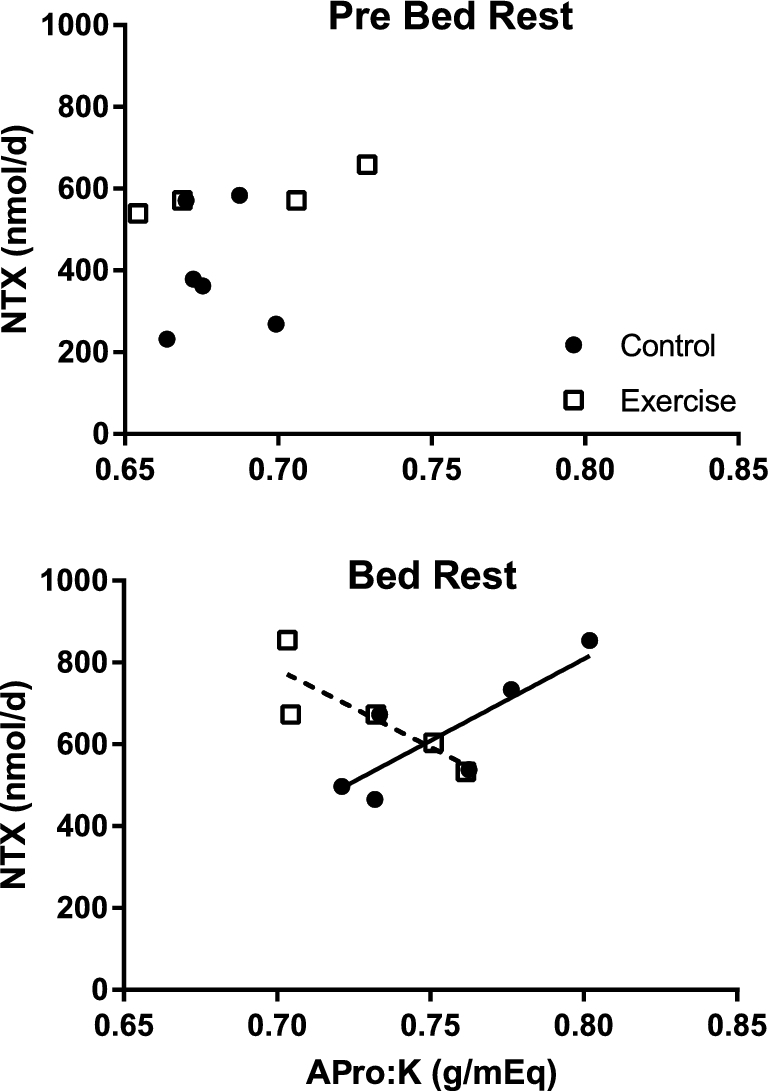
FIGURE 2.

Relation of NTX to dietary APro:K ratio before (Pre Bed Rest) and during bed rest in sedentary (Control, n = 6) and exercising subjects (n = 5). During bed rest the Pearson correlation between NTX and APro:K was significant for the Control (r = 0.82, P < 0.05) but not for the Exercise group (r = −0.84, P = 0.07). APro:K, animal protein:potassium; NTX, N-telopeptide.
