
Figure 6:
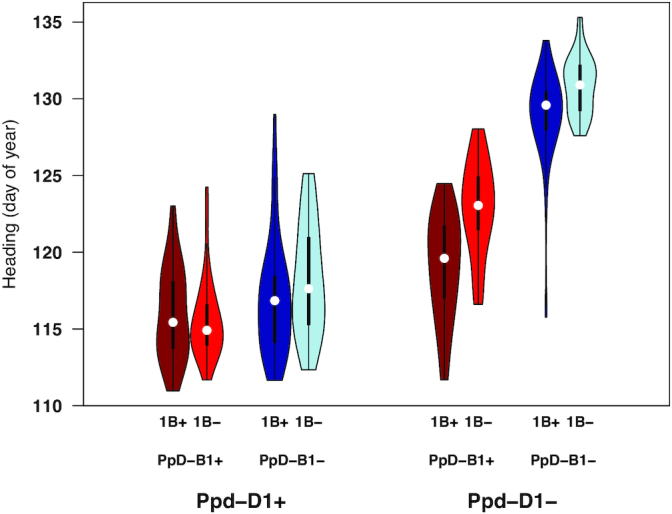
Epistatic interaction of loci controlling heading date. Phenotypic distributions of genotypes at loci showing significant epistatic interactions for heading date measured by CNN predictions including Ppd-D1, Ppd-B1, and QTL identified on chromosome 1B in the Lakin × Fuller RIL population. Plus and minus signs indicate genotypes with or without the early allele, respectively. In the violin plots, the white dots indicate the median, the thick bars indicate the interquartile range, and the thin bars indicate 1.5× the interquartile range.