
Figure 1.
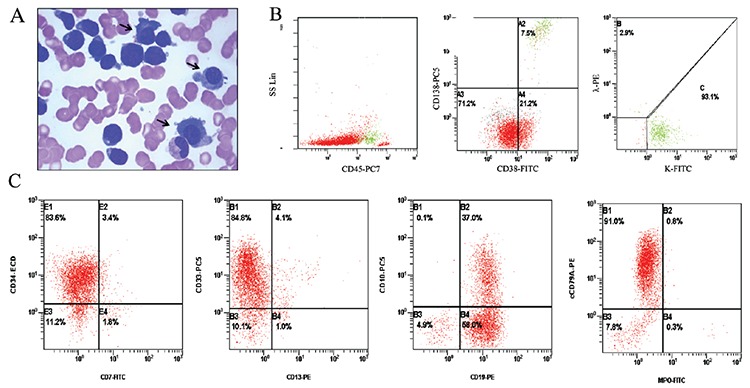
Patient 1: A) Black arrows point at malignant plasma cells, which are very different from other lymphoblasts (Wright-Giemsa staining, 100x). B) Malignant plasma cells were positive for CD38, CD138, and monoclonal kappa (green region of the scatter plot). C) The lymphoblasts were immunophenotyped as B-cell and expressed CD10, CD19, CD34, and cCD79a with aberrant coexpression of CD33. The morphologic and immunological characteristics of Patient 2 were similar.