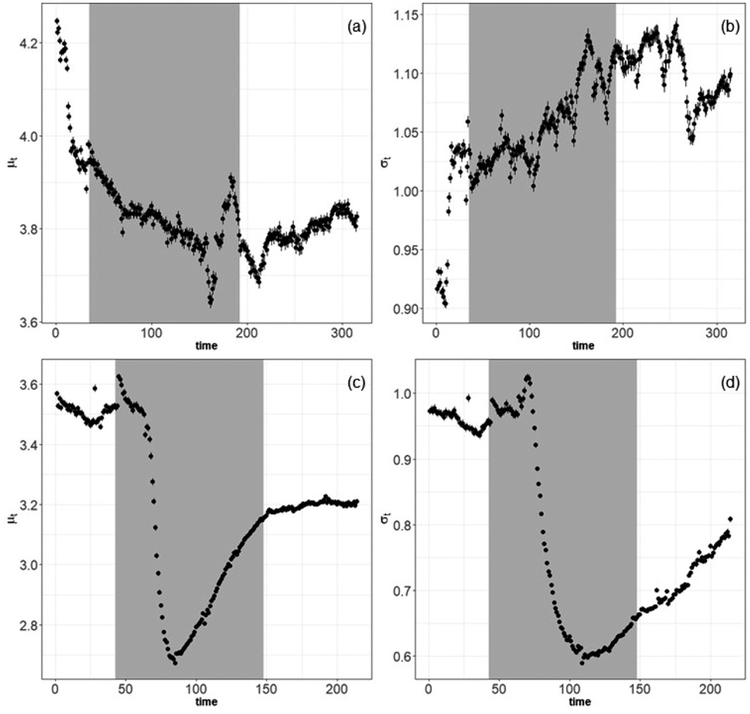
Figure 1.
Time series plots (in minutes) of: panels (a) and (c) the mean (μt) and panels (b) and (d) standard deviation (σt) of two 3-D printer emission tests. Panels (a) and (b) are results for the Pegasus SLA printer, and panels (c) and (d) are results for the M-One DLP printer. The gray area indicates the printing period. Black dots are mean values with Bayesian 95% credible intervals. All y-axes are log-scale.

