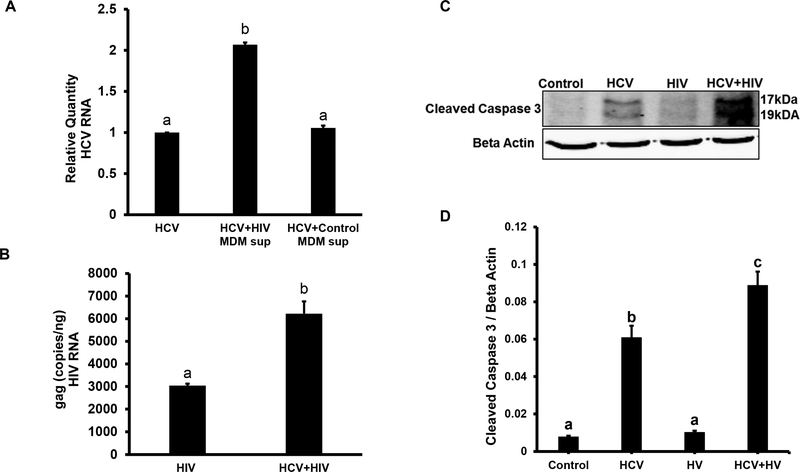
Fig. 1. HCV and HIV RNAs and caspase 3 cleavage in liver cells.
RLW cells were plated on plastic surface and then exposed to JFH1 (HCV) and supernatants from HIV-infected or uninfected macrophages as specified. A. HCV RNA (RT-PCR); B. gag HIV RNA (RT-qPCR); C. Cleaved caspase 3 (IB); D. Cleaved caspase 3 (IB quantification). All data (representative results and quantification) were conducted in duplicate and obtained from 3 independent experiments, and presented as Mean ± SEM. Bars with different letters are significantly different at p ≤ 0.05.

