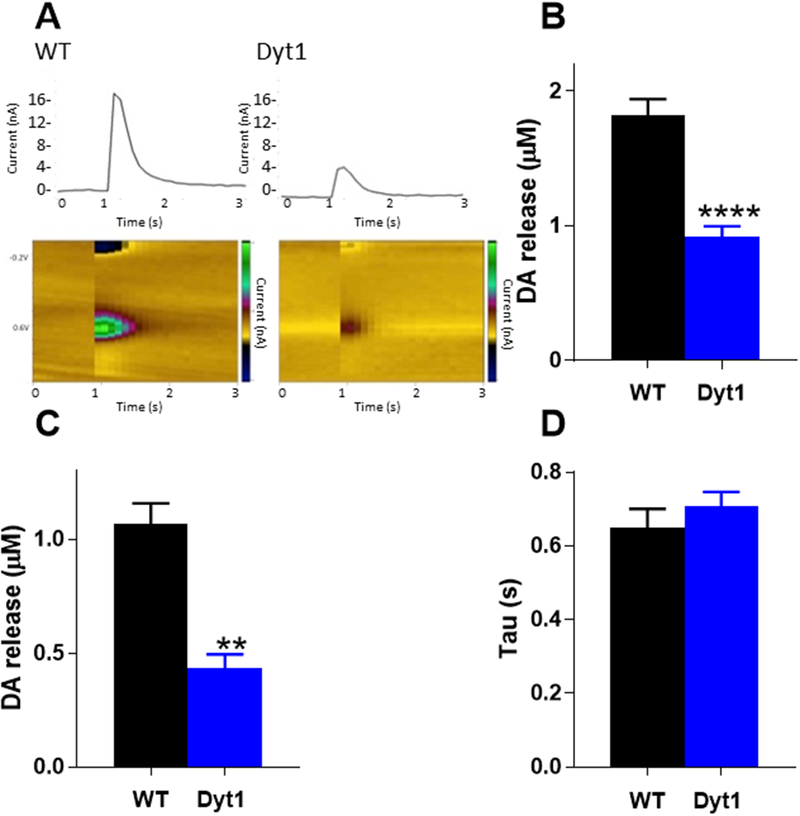
Fig 1. DA release in Dyt1 mice.
(A)Representative voltammograms and current traces of WT and Dyt1 DA release. 1-pulse electrical stimulation occurred at t=1 s. (B) Striatal DA release is significantly reduced in Dyt1 mice as assessed by FSCV (WT n=15; Dyt1=17). (C) DA release is significantly reduced in the nucleus accumbens core (n=3). (D) There is no change in DA uptake (tau) between Dyt1 and control animals (n=5). Values represent mean ± SEM.

