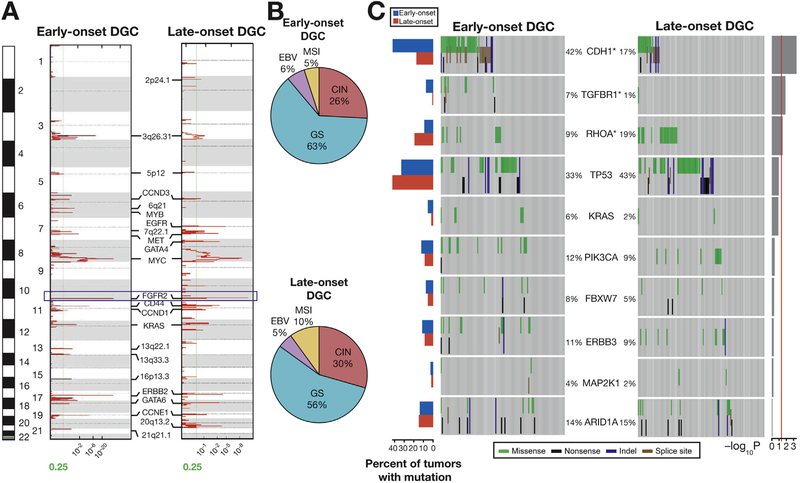
Figure 2.
SNP6.0 array-based copy number and targeted sequencing data in EODGCs and LODGCs (A) Significant focal amplifications in EODGCs (left; n = 109) and LODGCs (right; n = 115), according to the SNP6.0 array-based copy number analysis. Annotations include significant focal amplifications. Green lines indicate cutoffs for significance (q = .25). FGFR2 amplification (blue box) was the most significant focal amplification in both EODGCs and LODGCs. (B) CIN=was similar in proportion between EODGCs and LODGCs, suggesting an equivalent degree of aneuploidy between the 2 cohorts. (C) Targeted sequencing comparison analysis of 10 SNVs that were significant in the WES data of EODGC-WES. Left histogram, frequency of 10 SNVs in EODGCs (blue bar) and LODGCs (red bar); heatmaps, mutation events. The percentages of EODGCs and LODGC samples with non-silent somatic mutation are displayed at left and right sides of each gene name, respectively. *P < .05. Right histogram, log10 transformation of P value by χ2 test (EODGCs vs LODGCs). A continuous red line indicates a cutoff for significance (P = .05).

