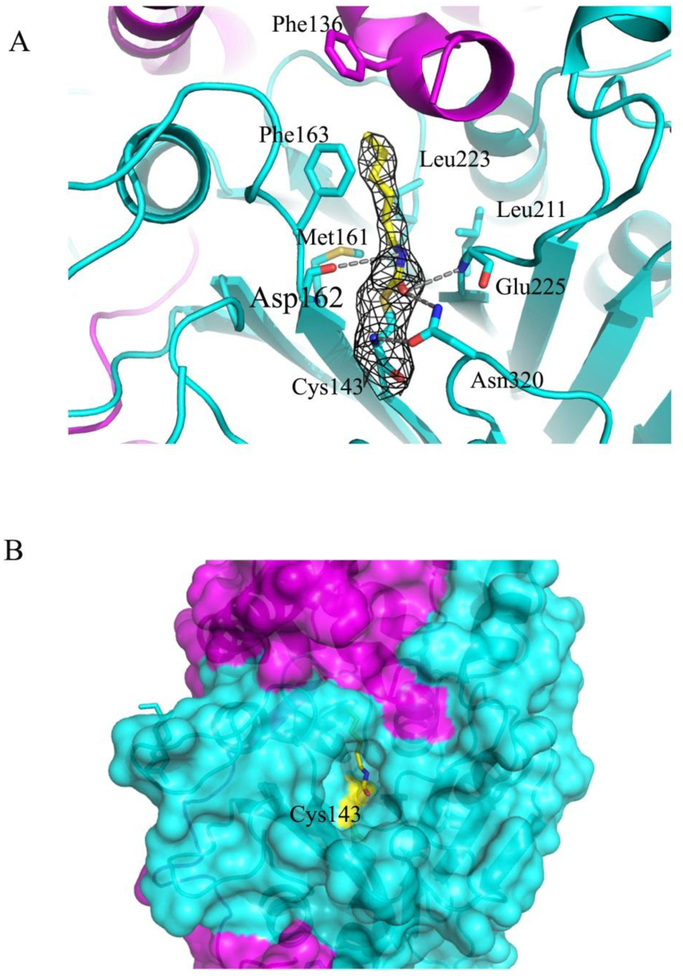
Figure 2. Binding interactions of the inhibitor fatty acid to AC active site.
(A) Close up view of the binding area in the complex (magenta and cyan ribbons for α– and β–subunits, respectively). The inhibitor moiety (yellow sticks) and the residues defining the interaction with the inhibitor (cyan sticks) are shown. The electron density map (grey) around the bound inhibitor is contoured at 1σ. Hydrogen bonds are indicated by grey dotted lines. (B) The part of the protein surface (in the same colors as in A) showing the deep channel into the active site with Cys143 covalently modified by the fatty acid (in yellow sticks) is presented.

