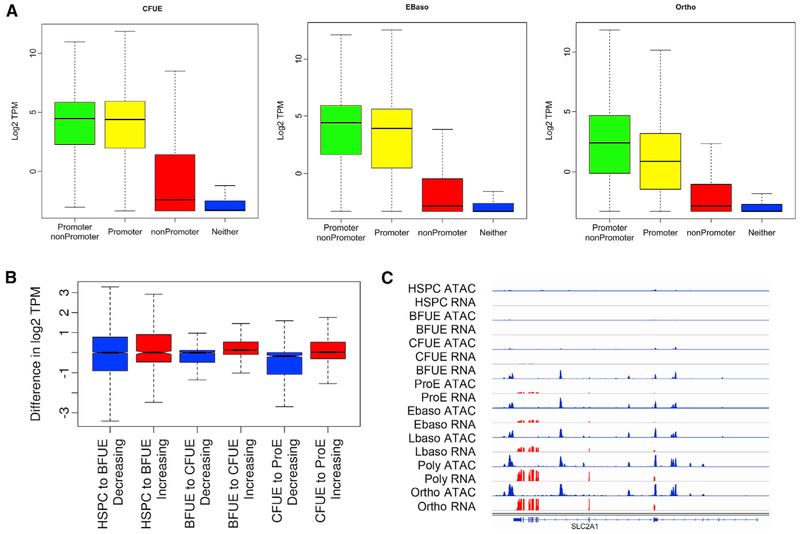
Figure 3. Chromatin Accessibility and Gene Expression.
Levels of gene expression determined by RNA-seq were correlated with the location of ATAC peaks in linked gene promoters, linked nonpromoter regions, both, or neither.
(A)Patterns of gene expression associated with ATAC peak presence or absence as described are shown in CFU-E, early basophilic erythroblasts, and orthochromatic erythroblasts.
(B)Levels of gene expression and gain or loss of ATAC peaks. In general, as gene loci acquired ATAC peaks, levels of gene expression increased. Shown here in the transitions from HSPC to BFU-E, BFU-E to CFU-E, and CFU-E to proerythroblast (ProE), the gene expression of linked genes that lost ATAC peaks (blue) is significantly lower than the expression of linked genes that gained ATAC peaks (red).
(C)SLC2A1 gene locus. Patterns of chromatin accessibility denoted by ATAC peaks (blue) are apparent in erythroid differentiation before the onset of detectable gene expression identified by RNA-seq (red).

