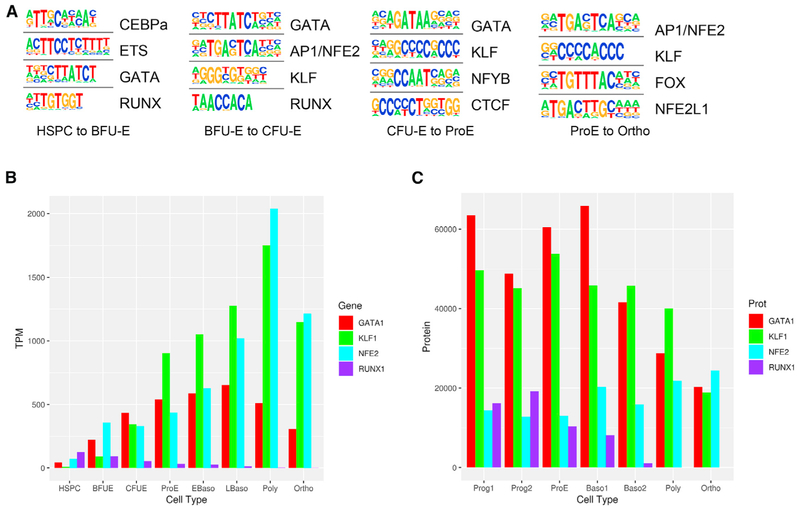
Figure 4. Transcription Factor Activity Changes across Erythropoiesis.
(A)The top regulatory protein-binding sites identified by the HOMER algorithm searching ±50 bp from summits of differential increasing stage to stage ATAC peaks. The top four motifs ranked by p value are shown for erythroid cell type transitions.
(B)Gene expression of critical erythroid transcription factors are shown for each stage of erythropoiesis. Transcriptome data are from An et al. (2014) and the present article.
(C)Protein expression of critical erythroid transcription factors are shown for each stage of erythropoiesis. Protein data are from Gautier et al. (2016).

