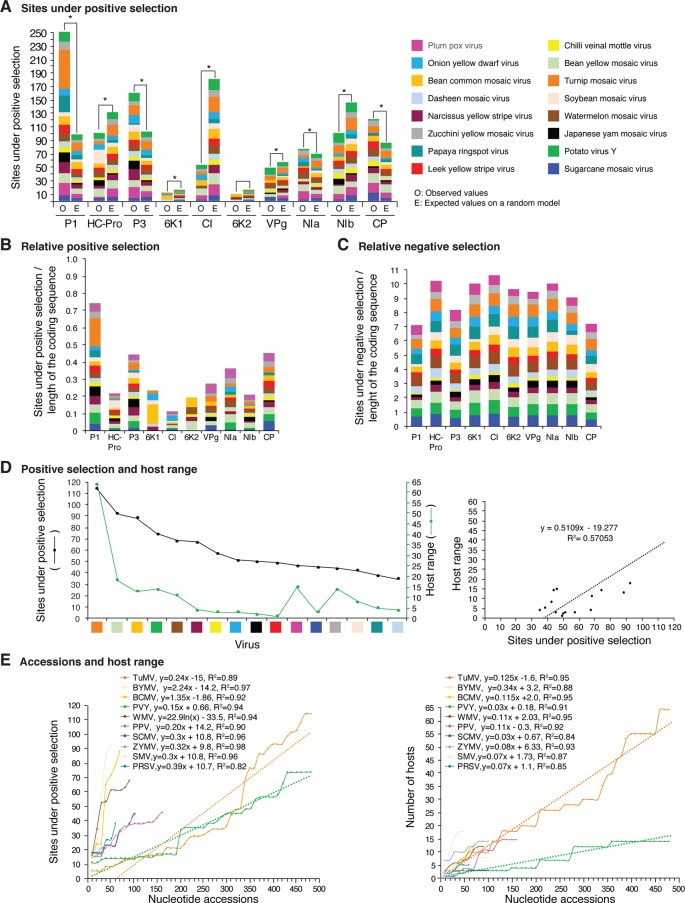
Figure 12.
Frequency of sites under positive or negative selection per cistron and their relation with host range in the top 16 viruses with the most variation. Only positive selection sites identified with both SLAC and MEME were counted. Sites under negative selection were detected with SLAC. Virus species are color coded. (A) Number of sites under positive selection compared to the expected randomly (sites per cistron/total for the open reading frame, and normalized to the length of the cistron). * indicates significant differences with p-value ≤0.001 as calculated by the Chi-square test. (B) Per virus and per cistron, sites under positive selection normalized to the number of codons. (C) Sites under negative selection per cistron and per virus, normalized to the number of codons. (D) Relationship between sites under positive selection and host range. (E) Relationship between number of accession and number of hosts. The left panel includes all viruses in panel (D). The panel on the left shows number of accessions in increments of 10. For each species, parameters of a regression line are indicated.

