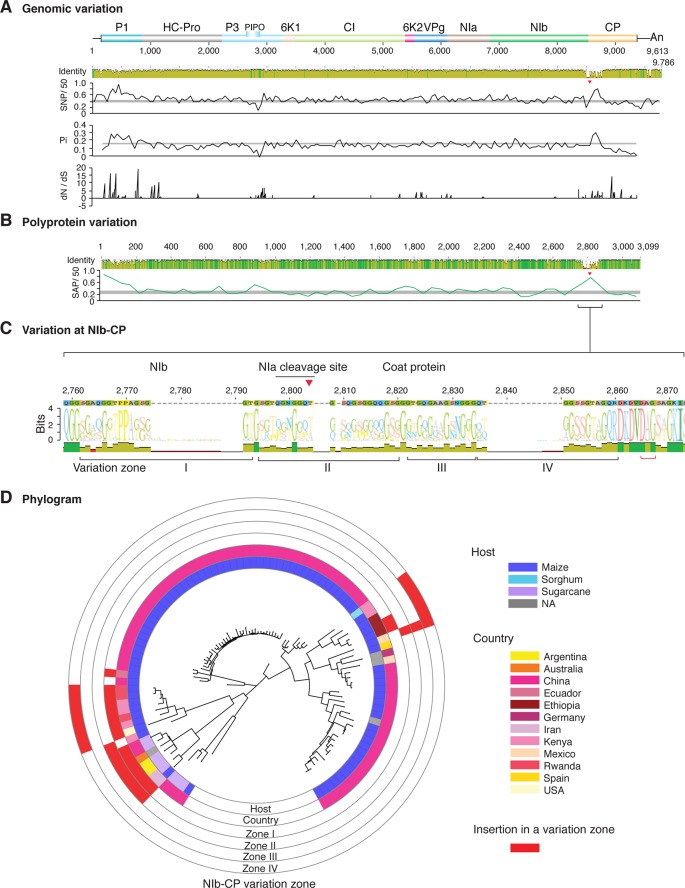
Figure 2.
Nucleotide and polyprotein variation in sugarcane mosaic virus. Accessions available were aligned to generate an identity plot. Coordinates are based on accession JX188385.1. (A) Genome-wide nucleotide variation. Single nucleotide polymorphisms (SNP) were estimated and normalized in a 50-nt window. The 5' and 3' UTR were included. Nucleotide diversity (Pi) and dN/dS ratio were estimated for the open reading frame in a 50-nt window or at each codon, respectively. The average and a 99% confidence interval are represented by a horizontal gray line. Arrow heads point to the NIb-CP junction. (B) Polyprotein variation. Single amino acid polymorphisms (SAP) in the polyprotein were estimated and normalized in a 50-amino acid window. The average and a 99% confidence interval are represented by a horizontal gray line. (C) Variation at the NIb-CP junction. The sequence logo includes the consensus. A red arrowhead points to the NIa-Pro cleavage site. The DAG motif is marked with a red bracket. Variation zones are numbered. (D) Phylogram. The phylogenetic tree in the center was generated using GraPhlAn using the full-length polyprotein sequences. Rings indicate the host, country of origin, and variation zones. A red mark indicates insertion at a variation zone.

