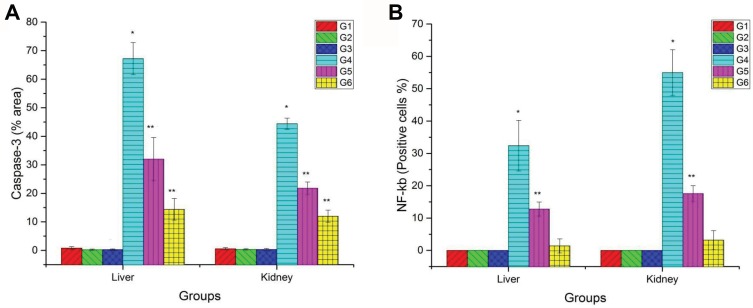
Figure 8.
Bar chart representing (A) the mean % area of caspase-3 immunopositivity in the liver and kidney tissue sections. (B) Percentage of NF-ĸB immunopositive nuclei within hepatocytes and renal tubular epithelium of rats in different groups. Values represented as Mean ± SD. *Indicates significant difference from the corresponding control group (G1) at P ≤ 0.05. **Indicates significant difference from the corresponding CuO-NPs group (G4) at P ≤ 0.05.
Abbreviations: G1, control group; G2, group received 1 mL/kg bwt PJ; G3, group received 3 mL/kg bwt PJ; G4, group received CuO-NPs; G5, group received CuO-NPs + 1 mL/kg bwt PJ; G6, group received CuO-NPs + 3 mL/kg bwt PJ.

