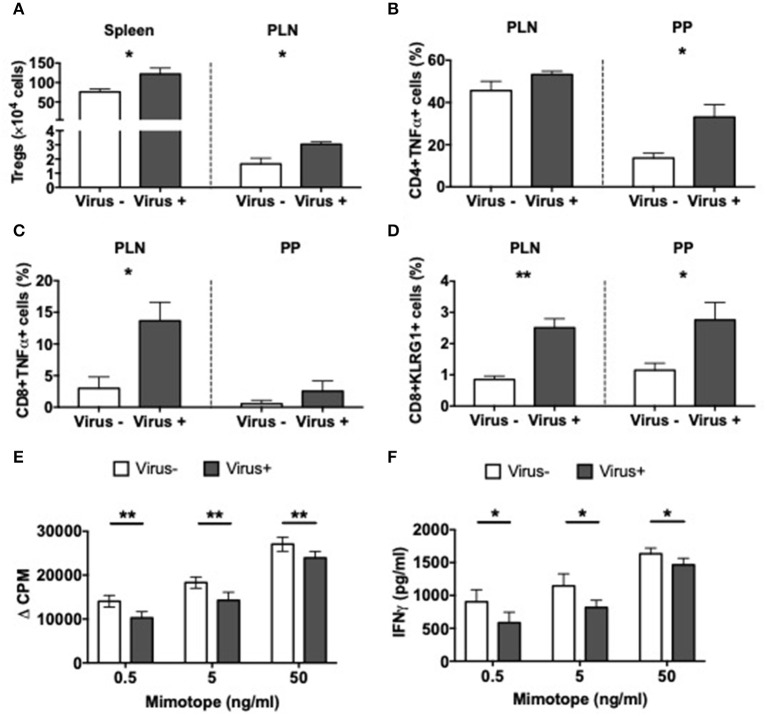
Figure 6.
Altered T cell immunity in norovirus colonized NOD mice. GF NOD mice were orally gavaged at ~4 weeks of age with pooled and filtered norovirus-enriched fecal filtrate from norovirus-infected NOD mice at 12-weeks of age that was UV-treated (virus–) or non-UV-treated (virus+). Only mice gavaged with the non-UV-treated filtrate were infected with norovirus and developed anti-MNV antibodies. (A) The number of CD4+FoxP3+ Tregs were calculated from live single TCRbeta+CD4+CD8- T cells prior to FoxP3 gating in the spleen and pancreatic lymph node (PLN). (B,C) Cells were stimulated for 4-h in the presence of PMA, Ionomycin, and Golgi Plug prior to surface and intracellular staining. TNFα-secreting CD4 (B) or CD8 (C) T cells were gated from live single TCRbeta+ cells prior to CD4 or CD8 gating then subsequent gating on TNFα. Cells shown are from the PLN and Peyer's patches (PP). (D) The proportion of KLRG1+ CD8 T cells gated from CD19-TCRbeta+CD4-CD8+ T cells prior to gating on KLRG1+ cells in the PLN and PP. (E) Proliferation of BDC2.5 CD4+ T cells to mimotope peptide in the presence of Tregs (1:2) from virus- or virus+ mice. Background proliferation (APCs + BDC2.5 + Tregs without peptide) was subtracted from proliferation with peptide. Data are shown as change in counts per minute (ΔCPM). (F) IFNγ measured by ELISA from Treg suppression culture supernatants in E. All data were assessed for significance using a Student's T-test. Data shown are representative of one of two experiments with n = 4 per group/experiment. *P < 0.05, **P < 0.01.

