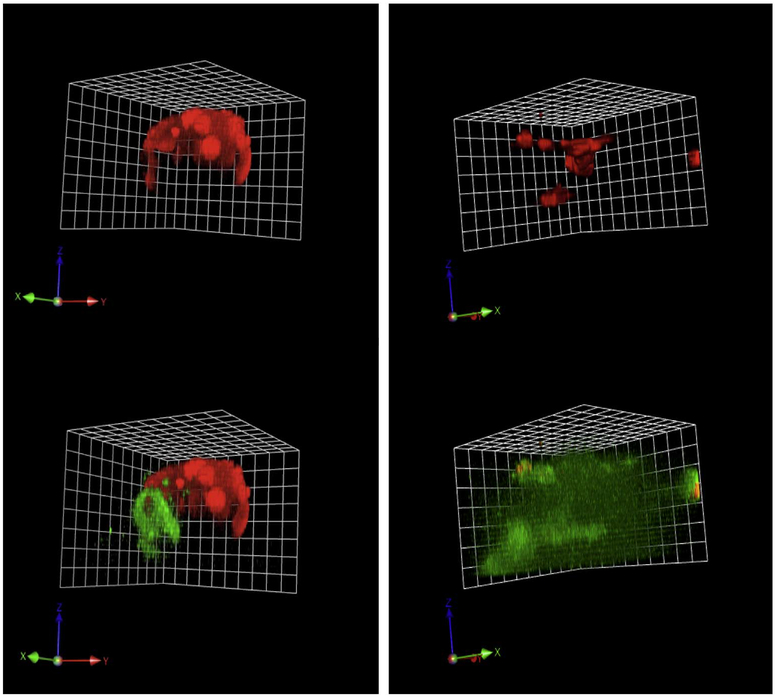
Fig. 2.
Pre-malignant phenotype of NF1 PN cells: increased matrix proteolysis. RFP variants of wild-type SCs and NF1 PN cells, were established in rBM mixed with dye-quenched (DQ) collagen IV. After six days, the live 3D cultures were imaged on confocal microscope and z-stacks of images were collected and reconstructed with Volocity software to show the structures. The RFP (red) marks the volume occupied by the cells. The cleaved collagen IV (green) shows the matrix proteolysis. The reconstructed 3D images from the confocal microscopy are angled views and representative of four rBM experiments for each cell line. Example movies of the 3D reconstructions are in supplementary data. One grid unit = 21.3 μm. Upper left, wild type cells, ipn97.4-RFP embedded in rBM (red channel only); Lower left, same cell structure as upper left but showing matrix proteolysis (overlaid with green channel). Upper right, PN cells, ipNF95.6-RFP embedded in rBM (red channel only); Lower right, same cell structure as in upper right but showing matrix proteolysis (overlaid with green channel).

