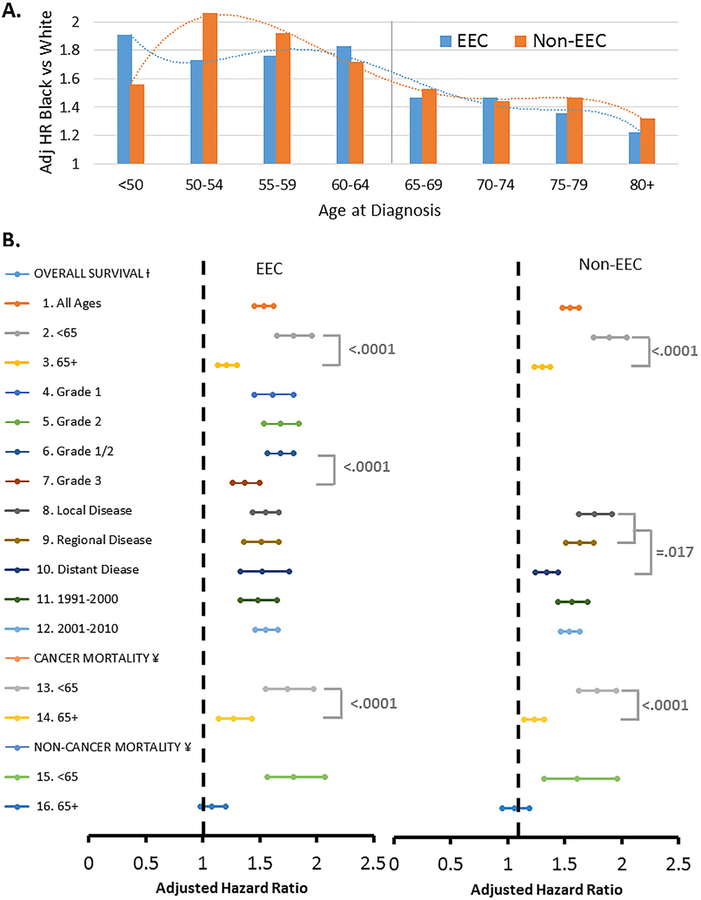
Fig. 3.
Adjusted risk of all-cause mortality (overall survival), cancer-related mortality and non-cancer mortality for black vs white endometrial cancer patients. A, This bar chart displays the adjusted hazard ratio (Adj HR) for black vs. white endometrial cancer patients with endometrioid endometrial cancer (EEC) or non-EEC histology who were <50, 50–54, 55–59, 60–64, 65–69, 70–74, 75–79 or 80+ years of age at diagnosis. This illustrates the dynamic inverse impact of age of diagnosis on racial disparities in risk of death in patients with both EEC and non-EEC. B, These Forest plots illustrate the adjusted hazard ratio and 95% confidence interval from Cox proportional hazards modeling† for overall survival in subsets 1–12 or sub-distribution hazards modeling of competing risks for cumulative cancer-related deaths (cancer mortality)¥ in subsets 13–14 or cumulative non-cancer deaths (non-cancer mortality)¥ in subsets 15–16. Analyses performed in patients with EEC are displayed in the left Forest plot whereas those in patients with non-EEC are shown in the right Forest plot. Cox modeling and competing risk analyses were stratified by age, stage, tumor grade and/or year of diagnosis for patients with EEC or by age, stage and/or year of diagnosis for patients with non-EEC. Differences in risk of death† or cumulative cancer-related deaths¥ were compared and P-values <0.05 for interaction tests were incorporated into panel B.

