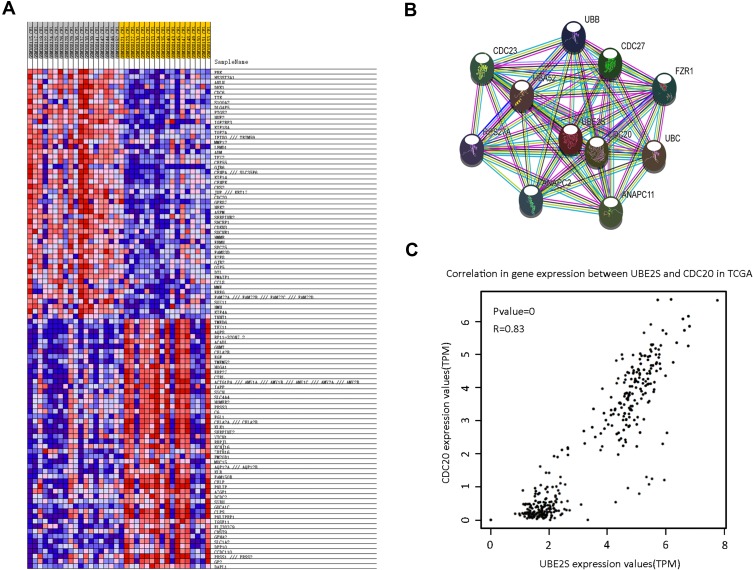
Figure 5.
UBE2S co-expressed with CDC20. (A) The co-expression heat map from GSEA. The result indicated that there may be a positive correlation between UBE2S and CDC20. (B) Protein–protein interaction network of UBE2S based on STRING database with number of first shell interactors limited to 10 and using a medium confidence (0.400). (C) The correlation analysis of UBE2S and CDC20 in TCGA.

