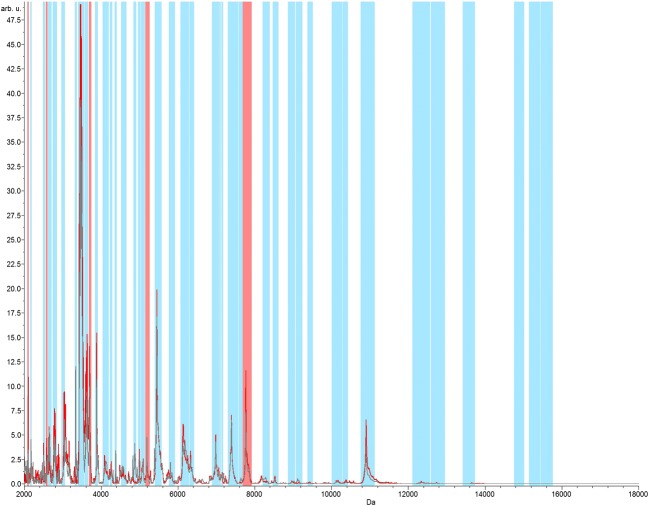
Fig. 5.
Neural network graphic acquired from strains SEMIA 5080 and SEMIA 5079 in the range of m/z 2000 to 18,000. The total average spectrum is in gray color. The red spectrum represents the class average spectrum that is calculated within the spectral recalibration workflow. In the analysis of neural networks, the matching peaks are represented by blue bars and the five differential peaks/regions represented by red bars

