Fig. 5.

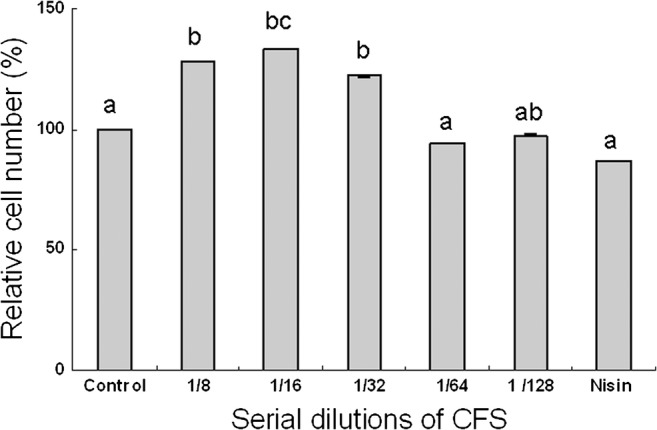
Cytotoxicity of different concentrations of CFS produced by E. coli E against NIH-3T3 determined by MTT assay after 72 h incubation. Values shown are the mean ± SD. (ANOVA, Turkey’s multiple comparison test, P < 0.05)

Cytotoxicity of different concentrations of CFS produced by E. coli E against NIH-3T3 determined by MTT assay after 72 h incubation. Values shown are the mean ± SD. (ANOVA, Turkey’s multiple comparison test, P < 0.05)