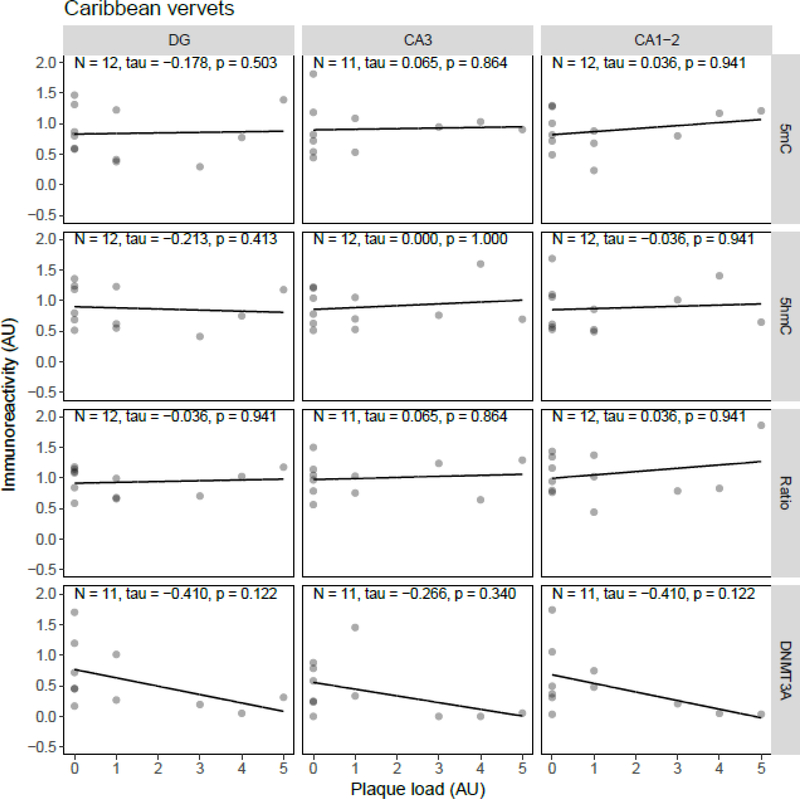
Figure 8.
Correlation analysis results between epigenetic markers 5-methylcytosine (5mC), 5-hydroxymethylcytosine (5hmC) and DNA methyltransferase 3A (DNMT3A) immunoreactivity (IR), and the 5mC:5hmC ratio, and plaque load in Caribbean vervets. Shown are the backgroundcorrected and scaled integrated density data plotted against the scores of hippocampal plaque load, for the dentate gyrus (DG), cornu ammonis (CA) 3, and CA1–2 subregions of the hippocampus. Fitted linear regression lines are shown for clarity. No statistically significant correlation was found between plaque load and any of the investigated epigenetic markers. AU, arbitrary units.

